
Remcos Unpacking
Introduction
Remcos or Remote Control and Surveillance, marketed as a legitimate software by a Germany-based firm Breaking Security for remotely managing Windows systems is now widely used in multiple malicious campaigns by threat actors. Remcos is a sophisticated remote access Trojan (RAT) that can be used to fully control and monitor any Windows computer from XP and onwards.
In this write-up I will explain the way I used to unpack it.
Sample Information
VT: Report
Sample Link: MalwareBazaar
UNPACKING
First of all, let’s examine that file in pestudio:
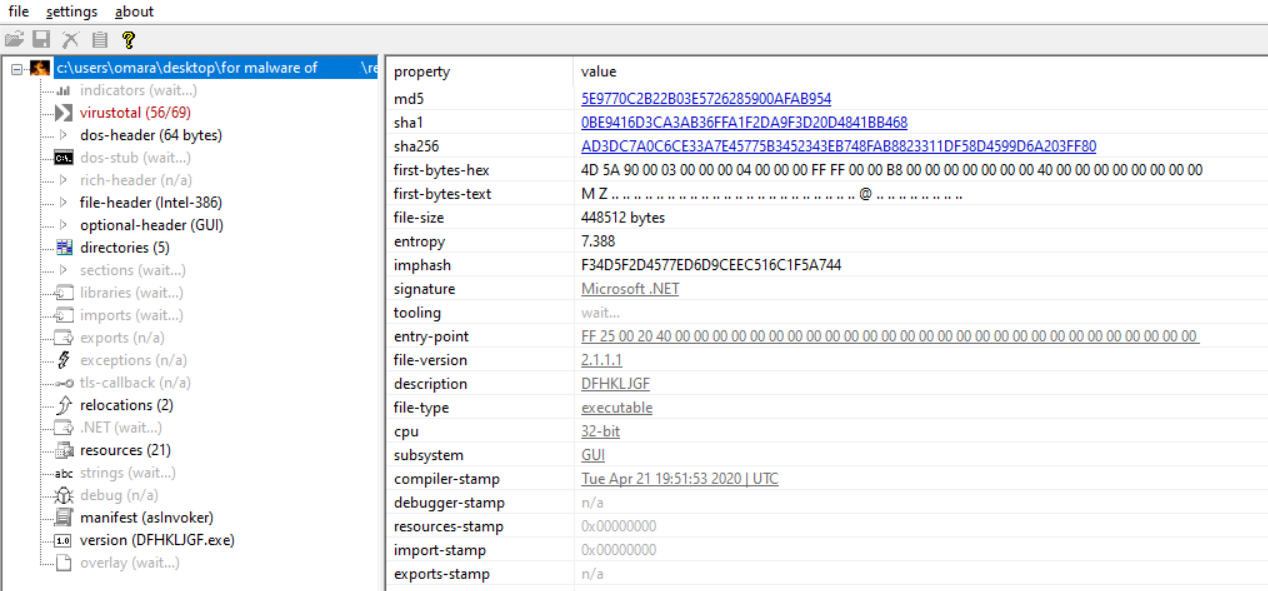
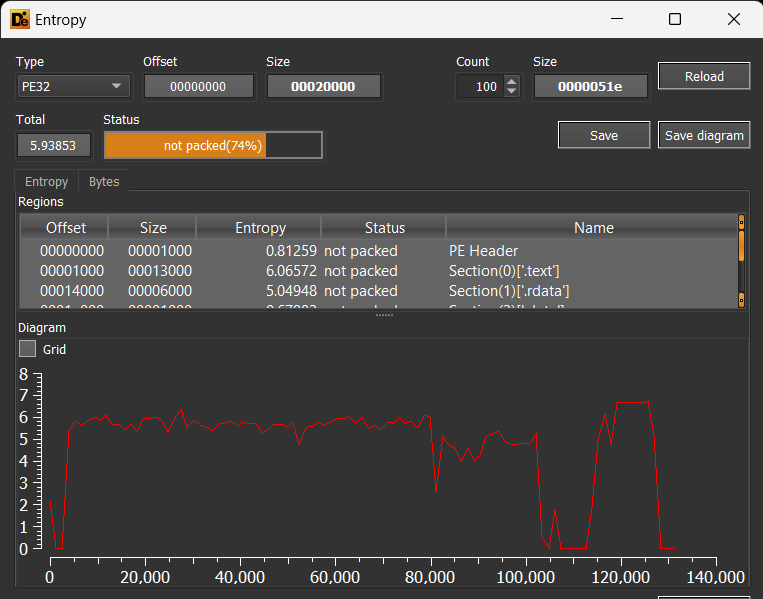
First to notice that it’s a 32-bit and has GUI, also it’s .NET. but the most interesting is the entropy of it, it has a high value. and if you tested it also in die:
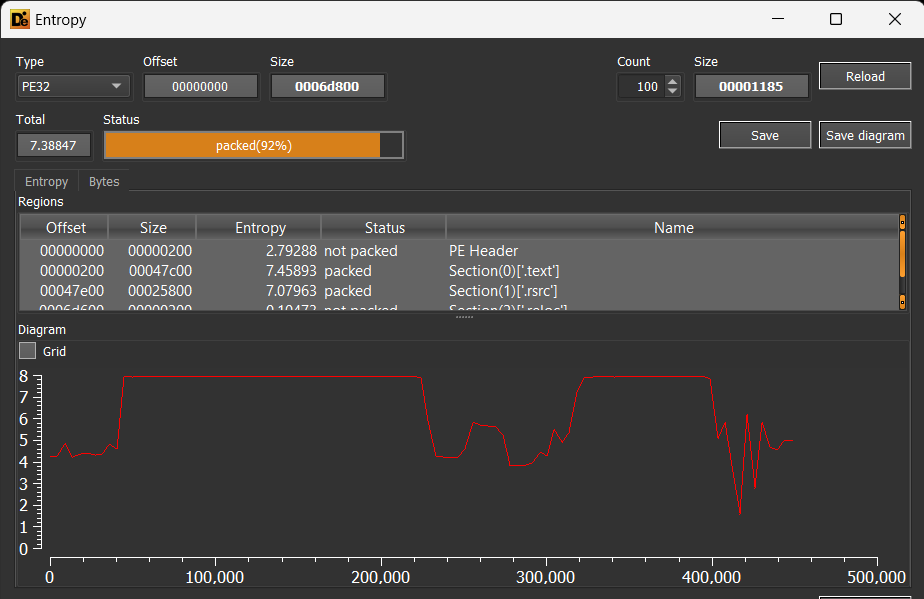
you will see that the .text section has high entropy and identified as packed; but can’t identify which packer it uses. so All of those are strong indicators that this binary is packed.
let’s then before running it in a debugger for test, let’s just upload it to Hybrid Analysis website to test it first for us.
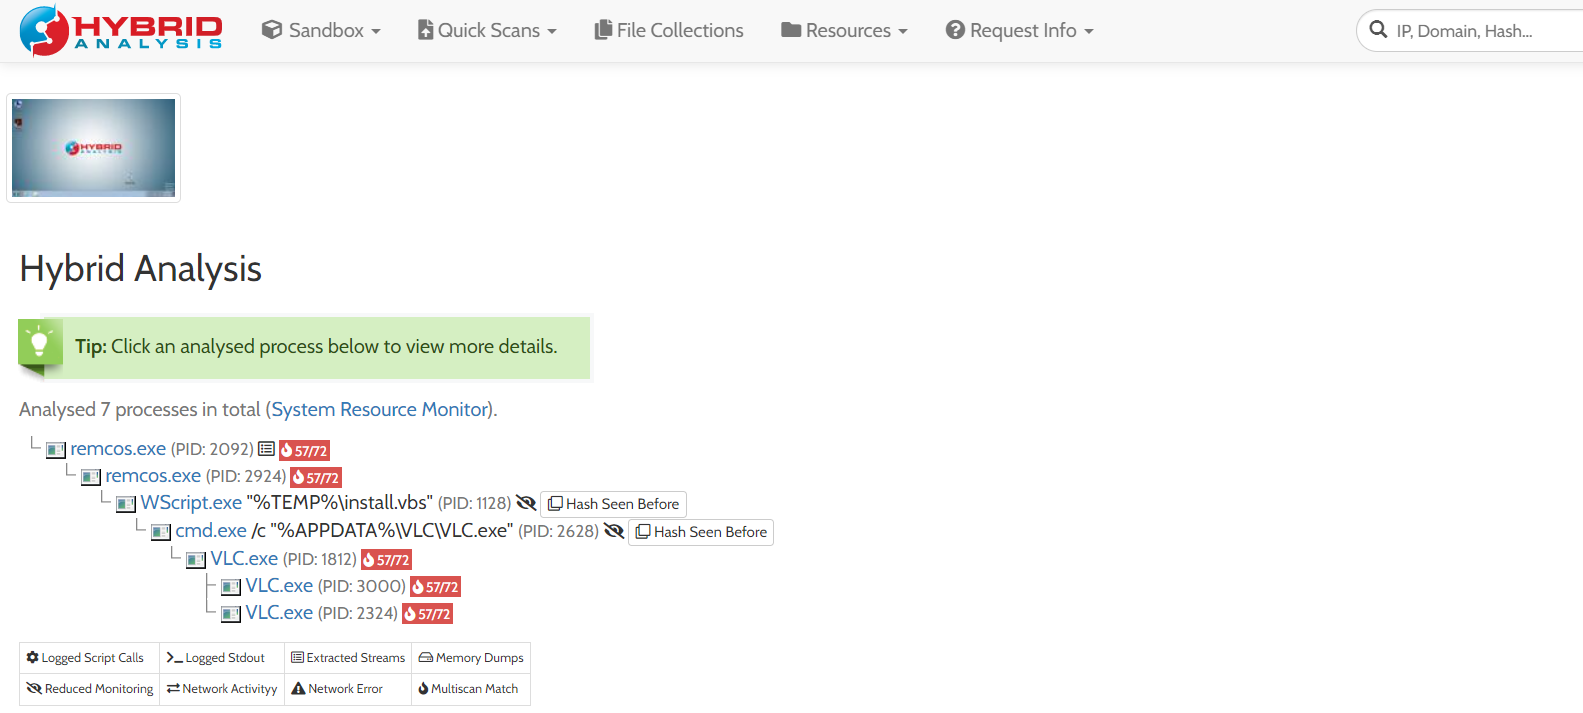
It’s a lot of information. let’s just focus on how it first unpack itself. you can see that the original executable starts itself again in the child process. and that’s actually a common way for stub to unpack itself; by running another instance of itself with suspend flag, then inject the real code inside it then run that instance. so now let’s manage our thoughts:
- first we need to set break points on APIs that it will be used to create a process, let’s choose CreateProcessInternalW. this is the lower-level API that will be called when any high-level API Process creation (there’s a lower-level one called NtCreateProcessEx that resides in ntdll; it’s the lowest possible api in user-mode , but now this api is enough for us) .
- and also it injects some code inside the newly create process, so let’s also try to catch this by setting a break point on WriteProcessMemory API.
- as i said before the newly create instance will be at first at the suspend state, then after it will inject it’s code it will try to make it run again. so let’s set a break point to catch any try to run the thread of that process, so break point on NtResumeThread API. (it’s also low-level api like CreateProcessInternalW)
- we have forgot that before it inject it’s code, it has to allocate space for it first, BP on VirtualAlloc API. (but I recommend to set it after the entry breakpoint not after system Breakpoint, you may see a lot of calls to this API)
- some packers uses some anti-debugging technique, so let’s set break point on IsDebuggerPresent. it’s the simplest way that may used as ant-debugging technique.
so i think now we are ready. let’s run that sample in X64 Debugger in Windows VM.
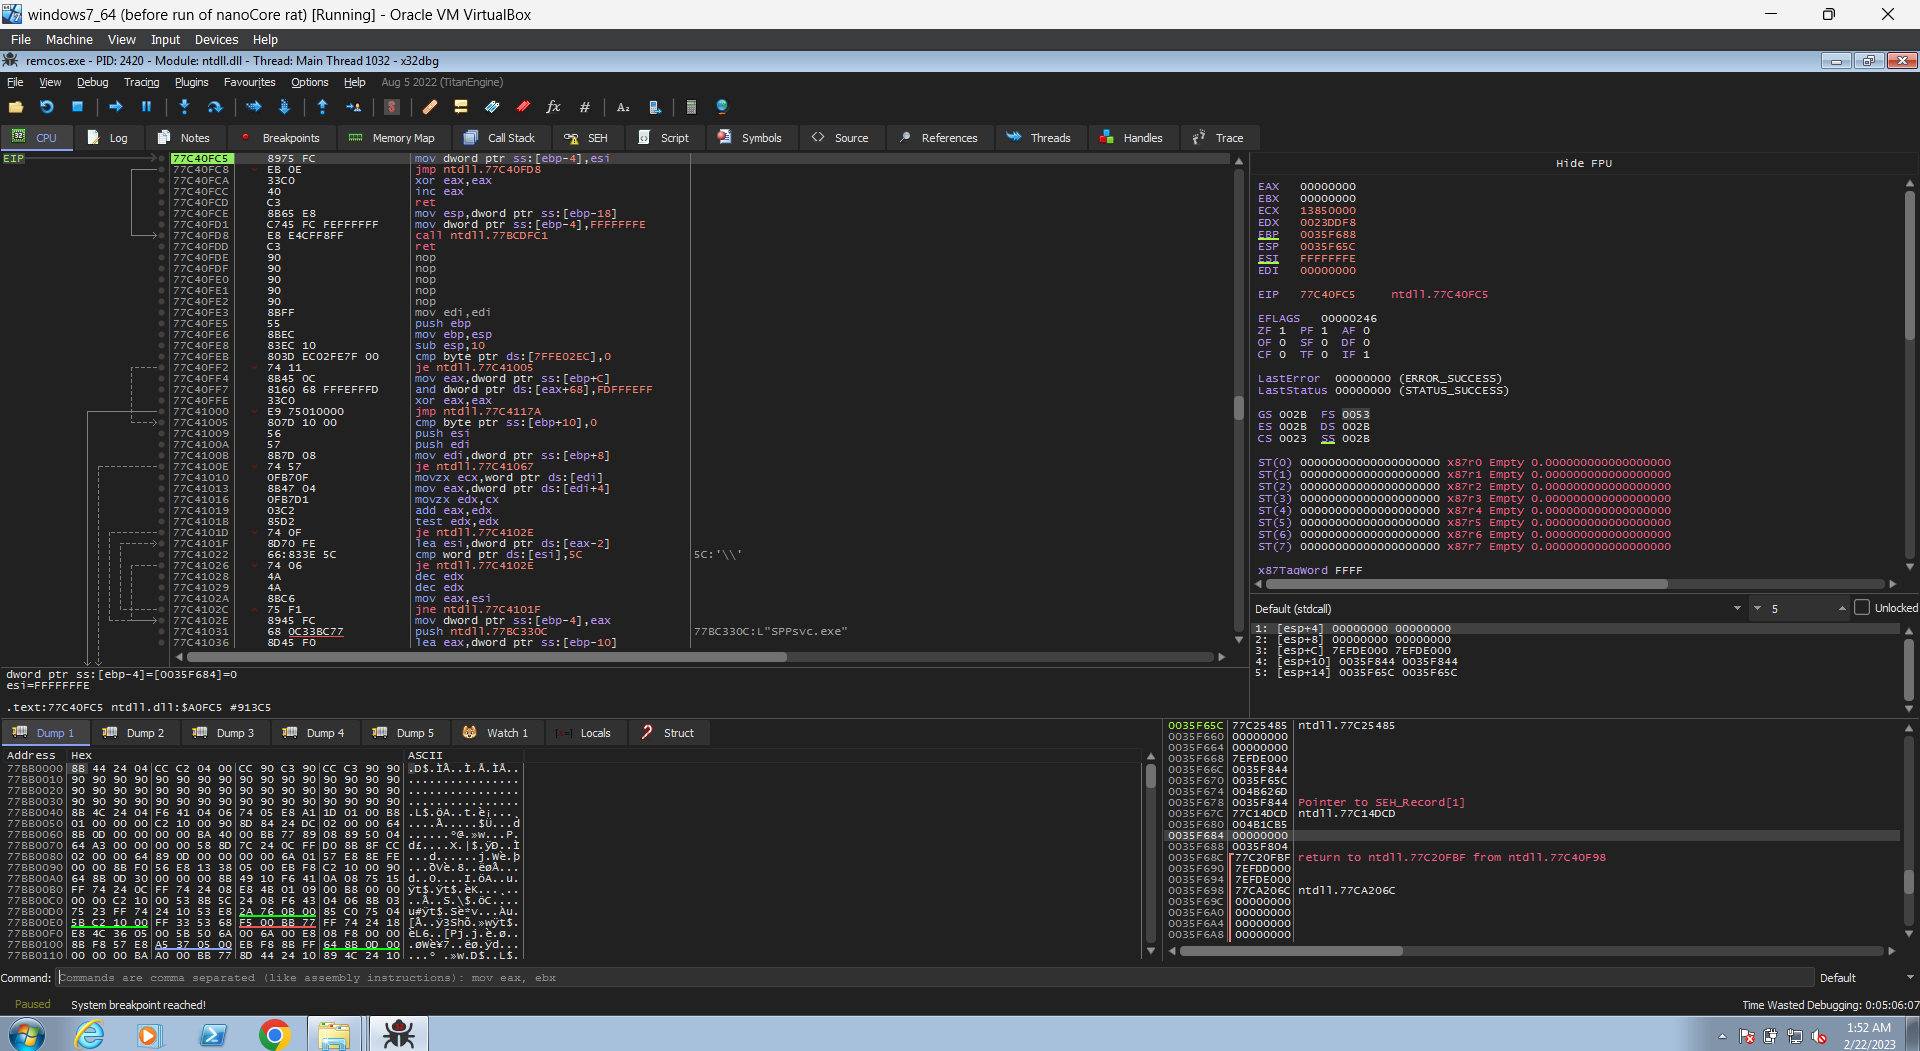
so now let’s set our break points in the command at the bottom, using the bp <Name of API> form. and then run it.
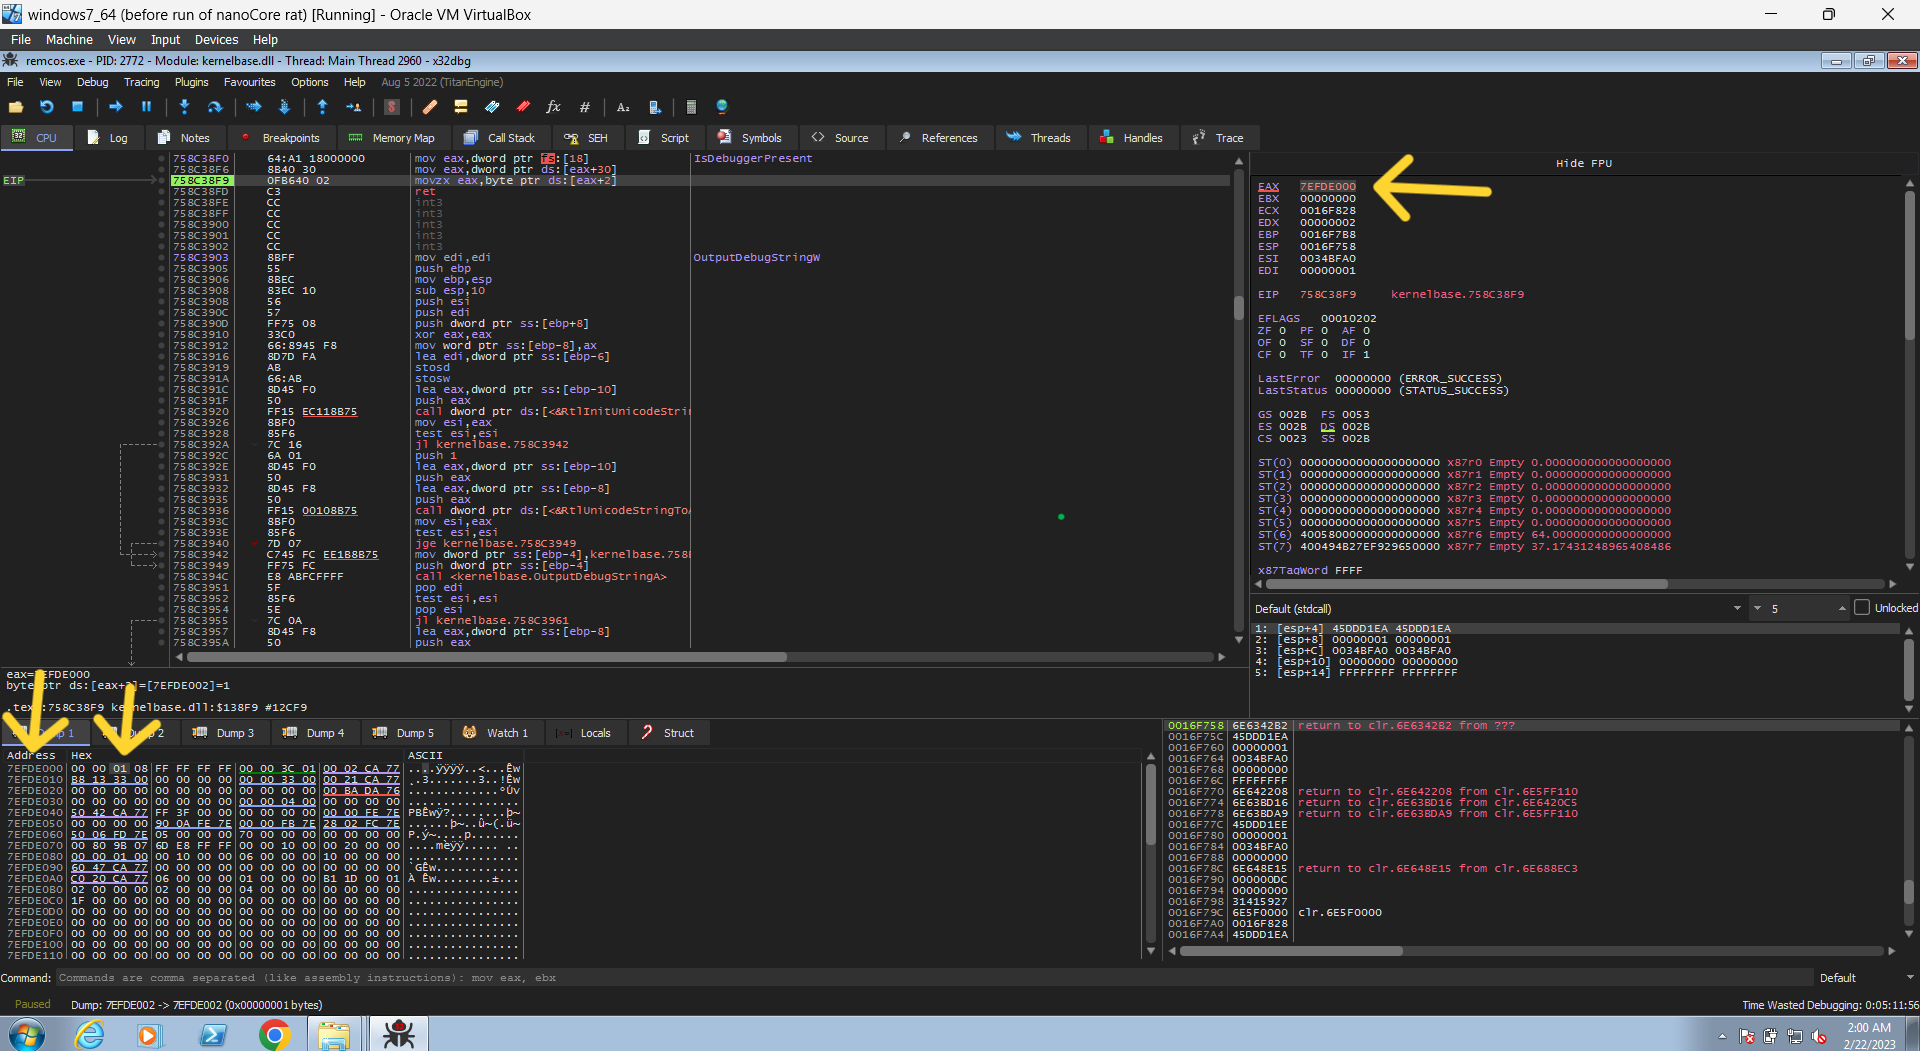
the first hit will be at IsDebuggerPresent, to bypass it just continue until it gets the address of the PEB structure from the TEB structure (see this article for further info), then follow that address in dump and change the value in the first block from 1 to 0
this value is the BeingDebugged member inside PEB Structure, see the Documentation for more read
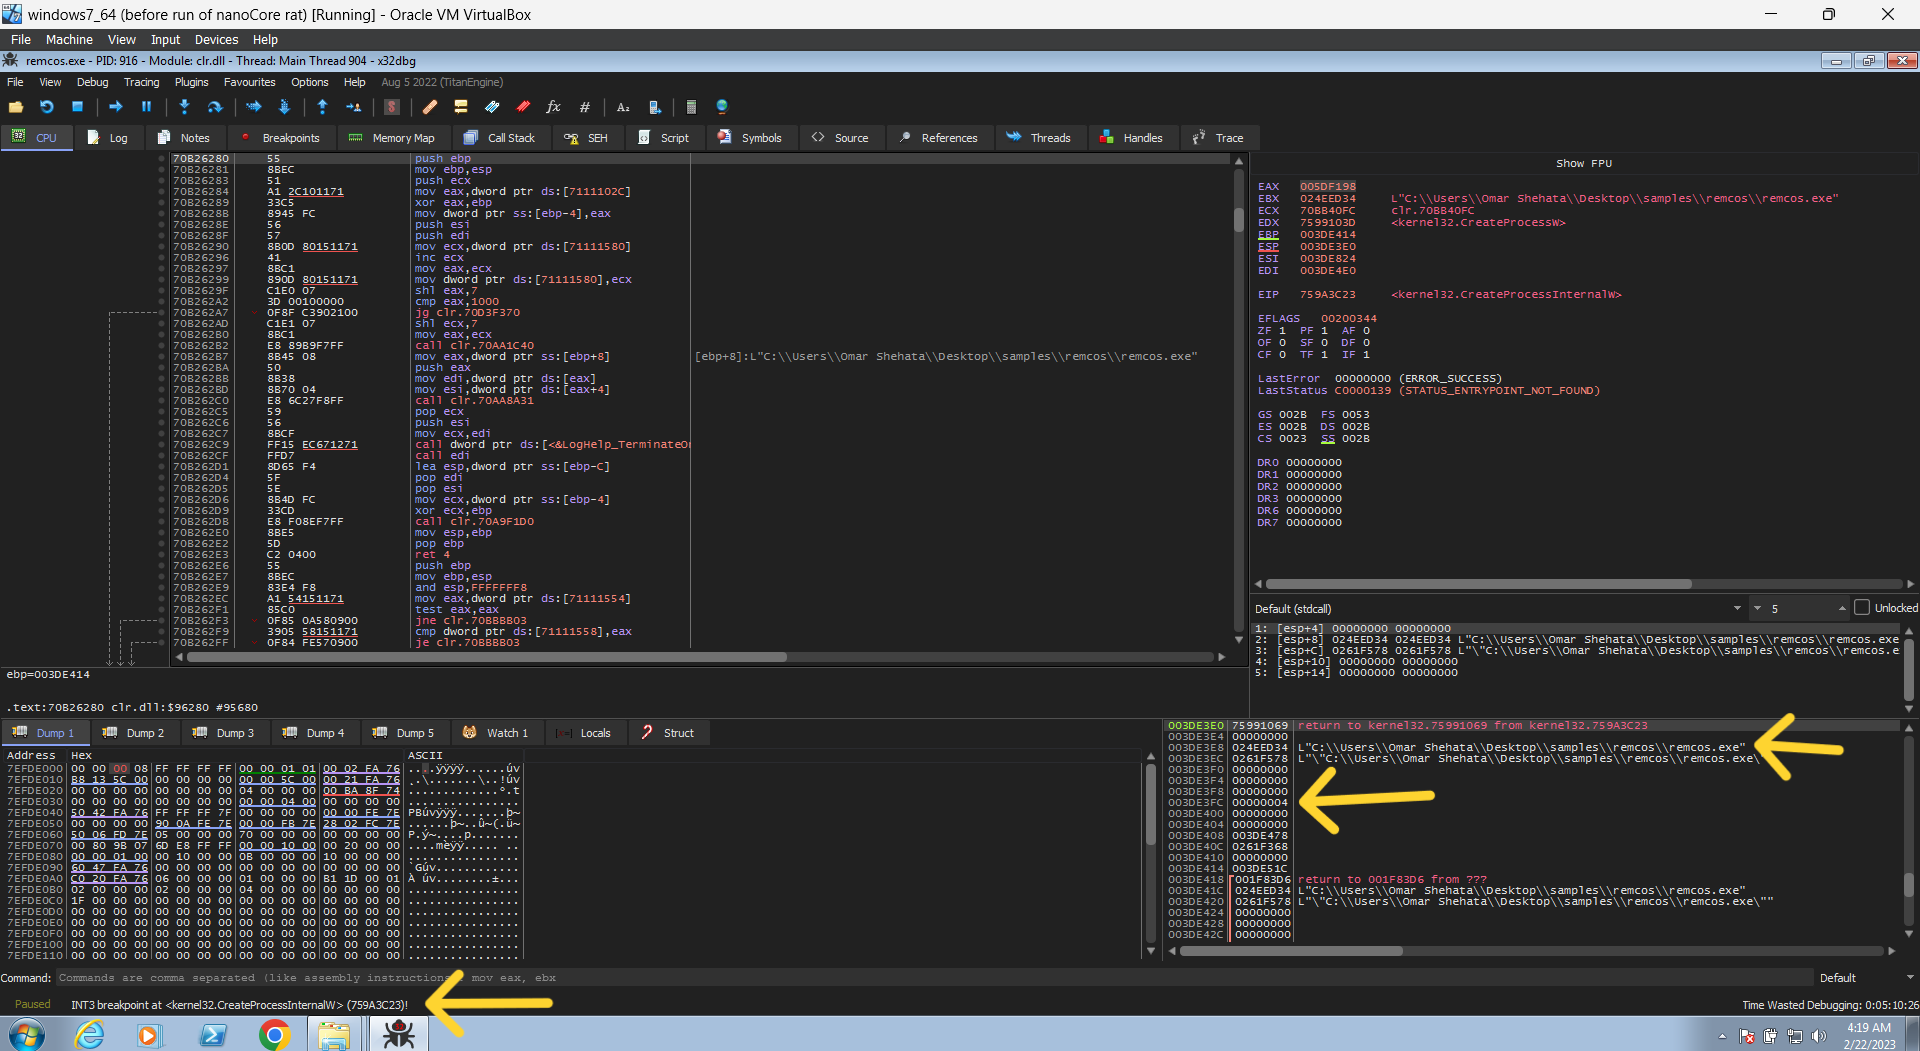
then continue, it will call same api many times but now you bypass it automaticly. so it will continue until it hits at the call of CreateProcessInternalW. here we can see from the stack the parameters it passes to it, the only one that is important is the 2nd and 7th. the second is the application name, and the seventh is the creationFlags, so it runs the same exe with create flag of 0x4 ( which is the suspend state). so again let’s continue running..
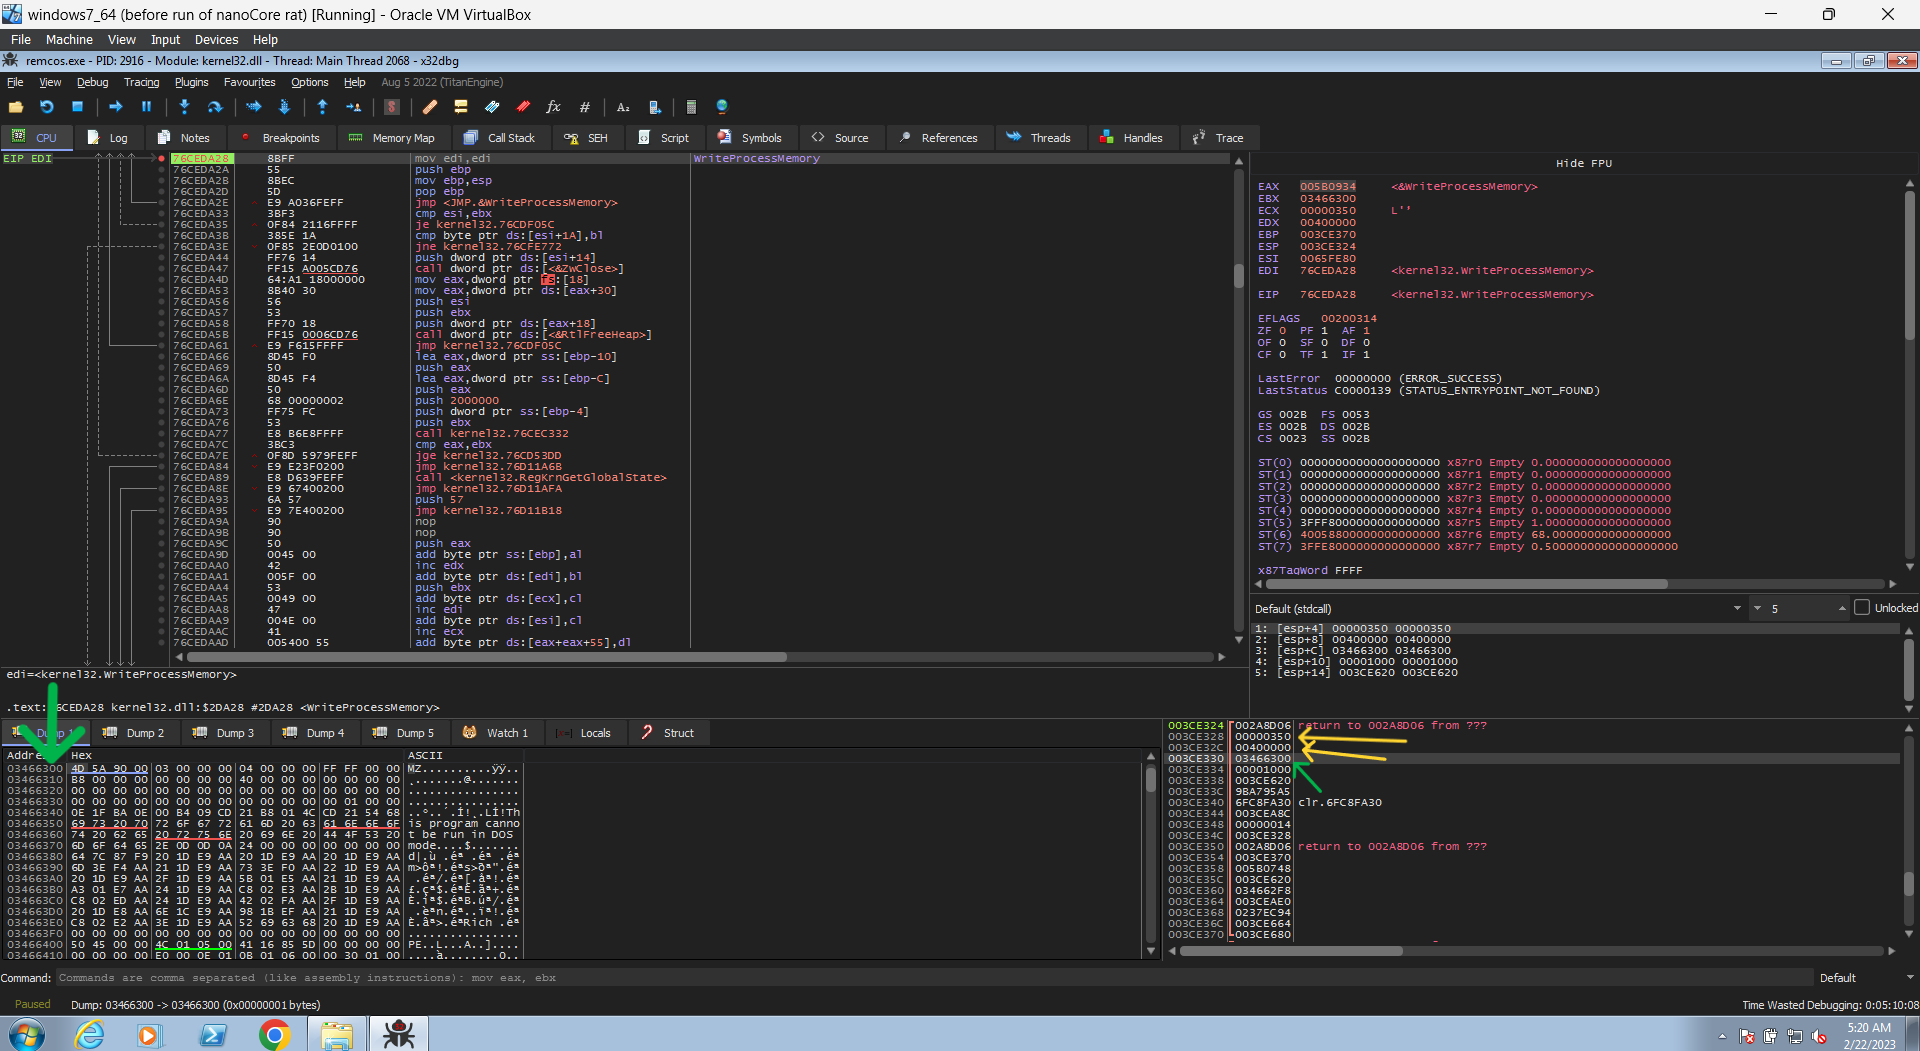
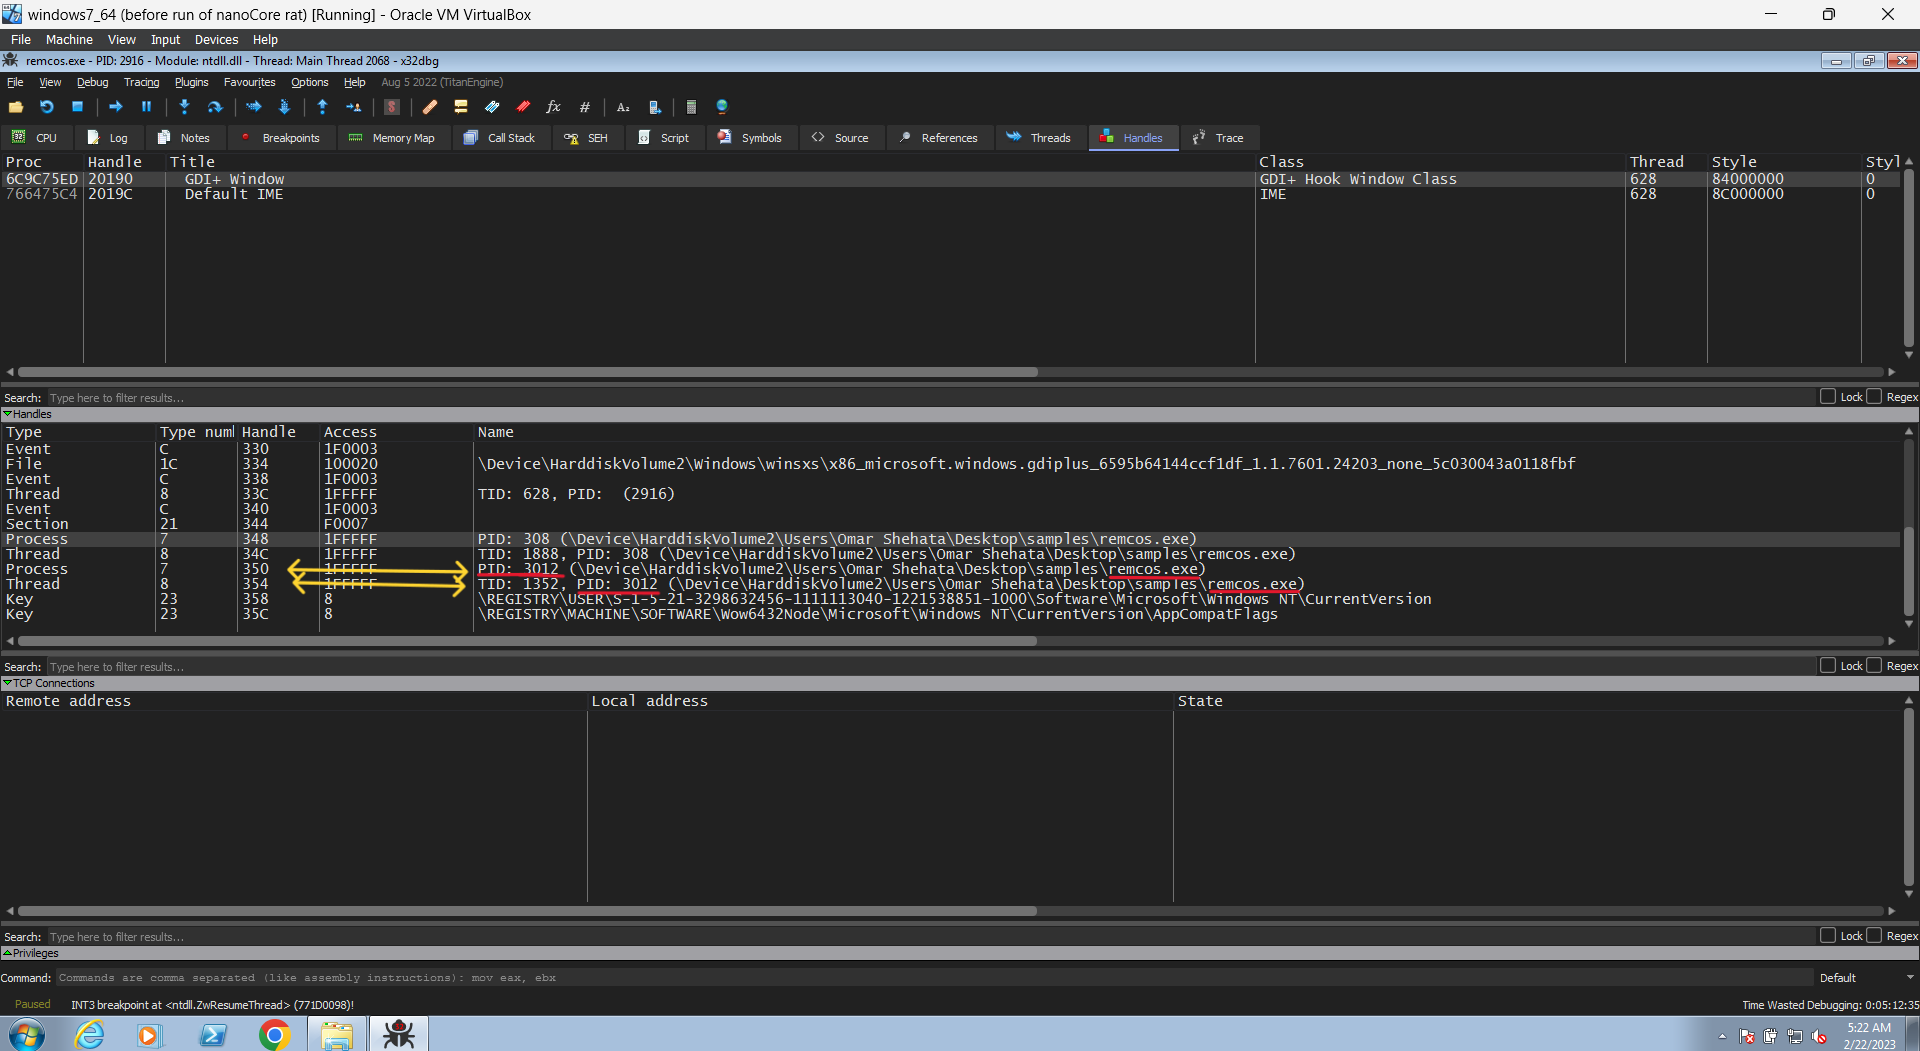
now we hits the WriteProcessMemory. the first parameter is the handle of the file it will write into, and if you searched for that handle (0x2FC) it’s handle to the newly created process. the second parameter is where it will write into, and the third one is buffer of the data that will be written. so if you followed up that address of the buffer in the dump you will notice that it’s really a start of a PE file, but something else is that there isn’t enough data to be written to be executed. it’s just writting 0x1000 bytes.
but if you continued the execution you will notice that this api is called again with the same handle but the start address is different and also the buffer, the start address here is actually the start address from the previous write + the size of the buffer that was written (0x400000 + 0x1000) , so it now writing another data after it. now it make more sense.
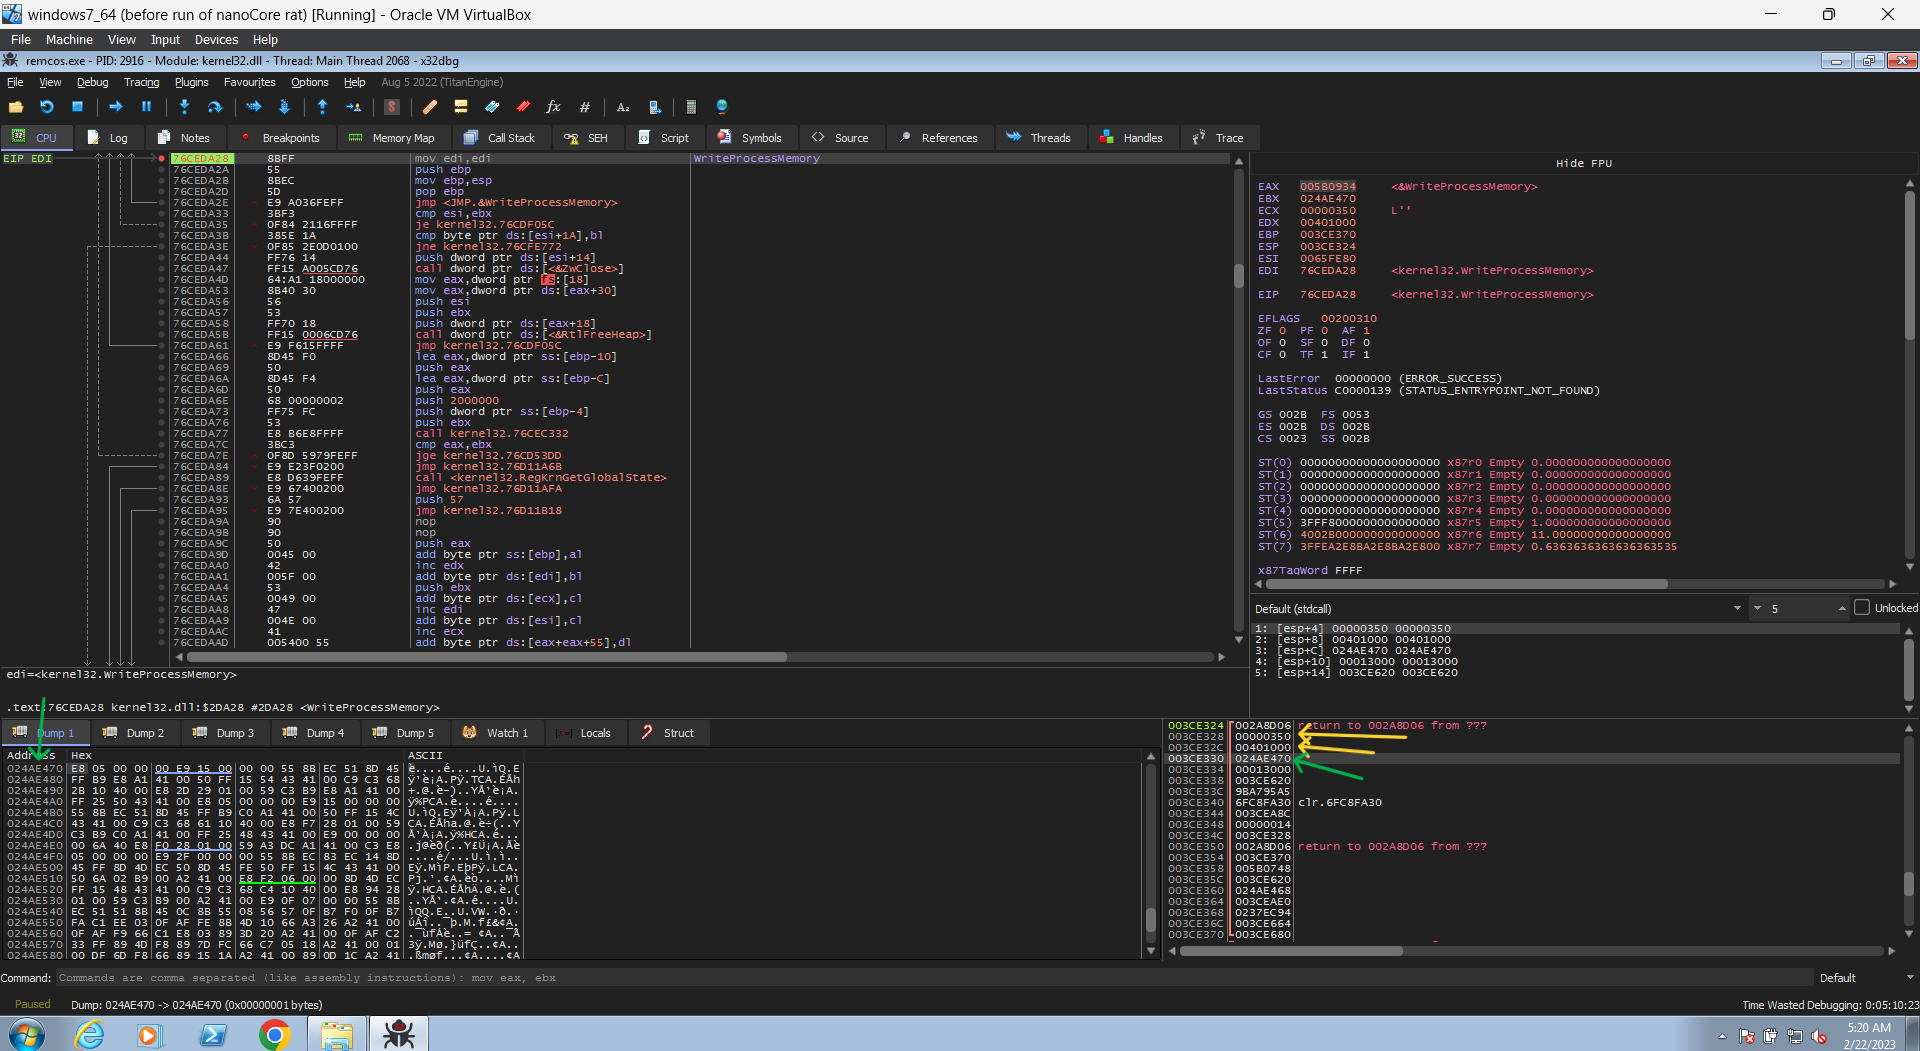
so it’s just divided the data that will be written into some buffers and it write them separately after each other in the new process.
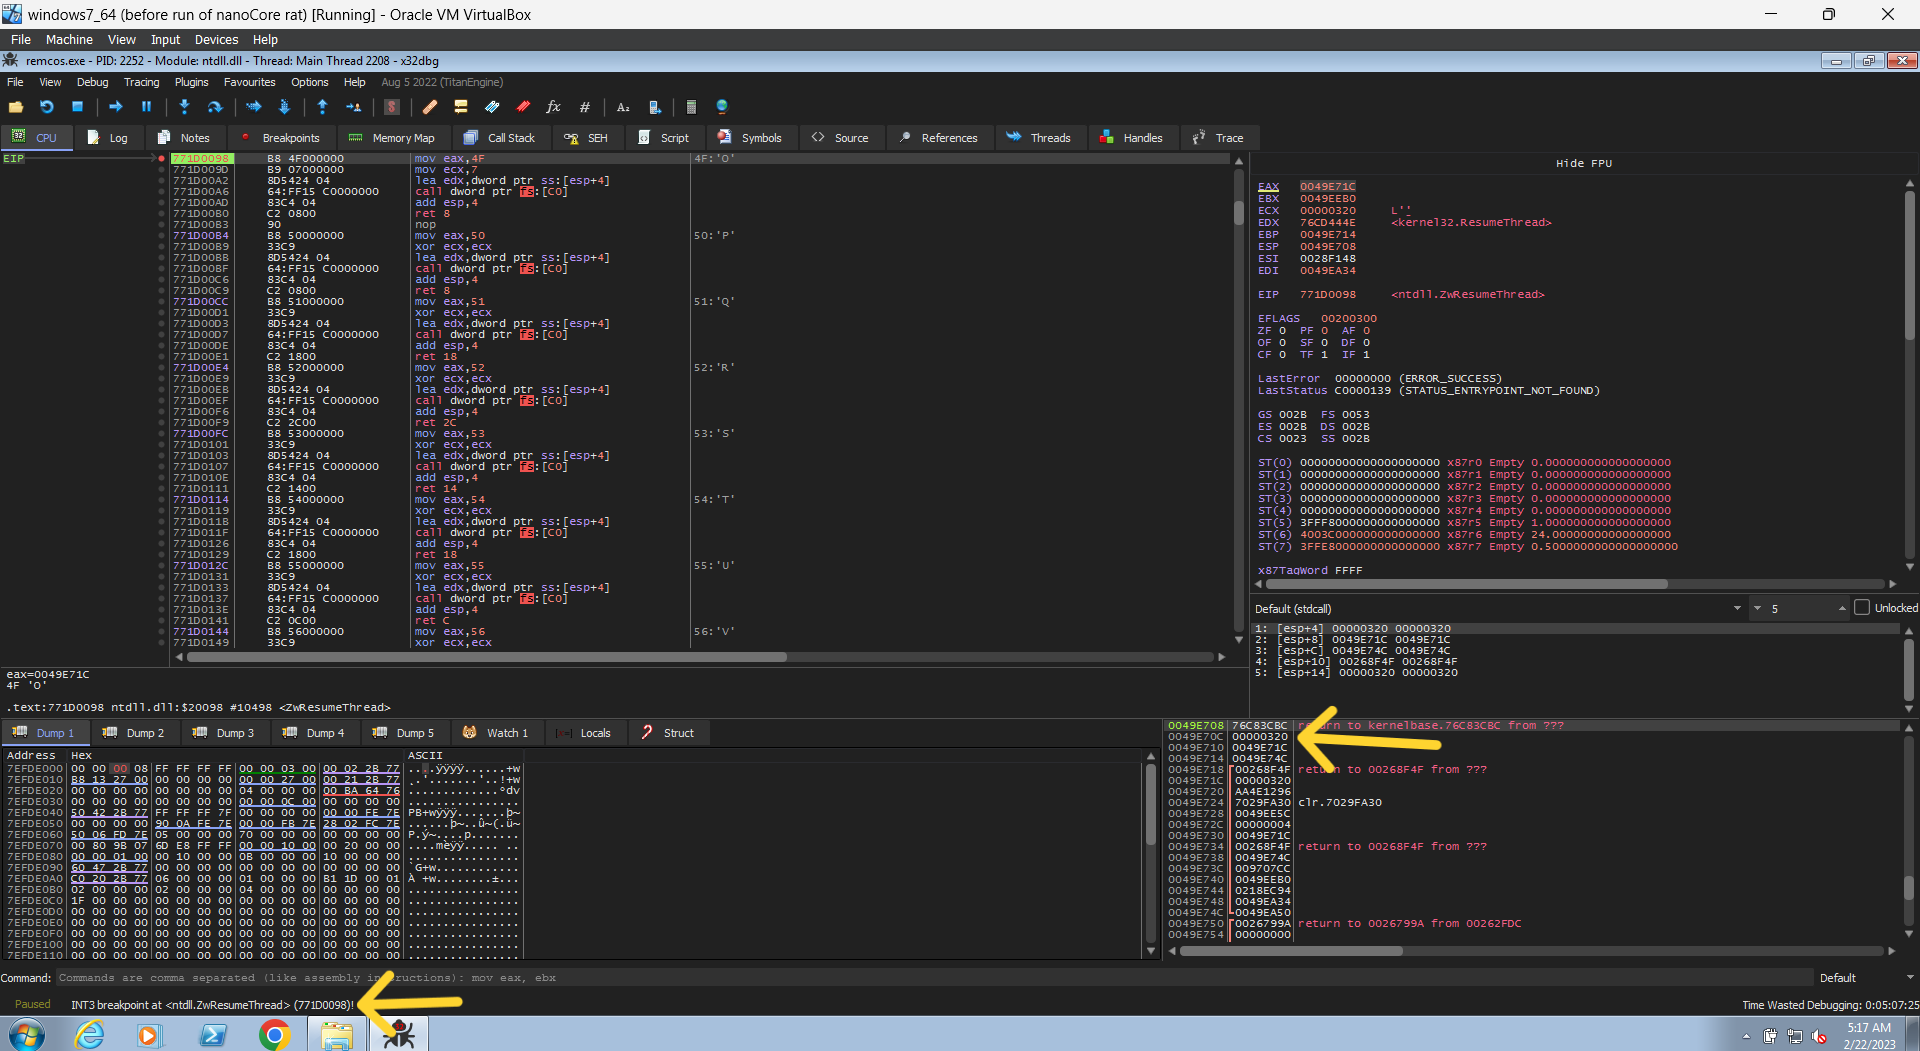
so let’s continue to execute until it finish them ( it will write many times), then after them you will find that it calls NtResumeThread with handle to thread. if you searched to that handle again you will also see that it’s handle to a thread that resides in the newly create process.
so now the actual code has written, let’s dump it. I will dump it from Process Hacker tool. when i open the process and choose the memory, then search for the start address of that newly injected code (which was 0x400000) then right-click on it and choose save.
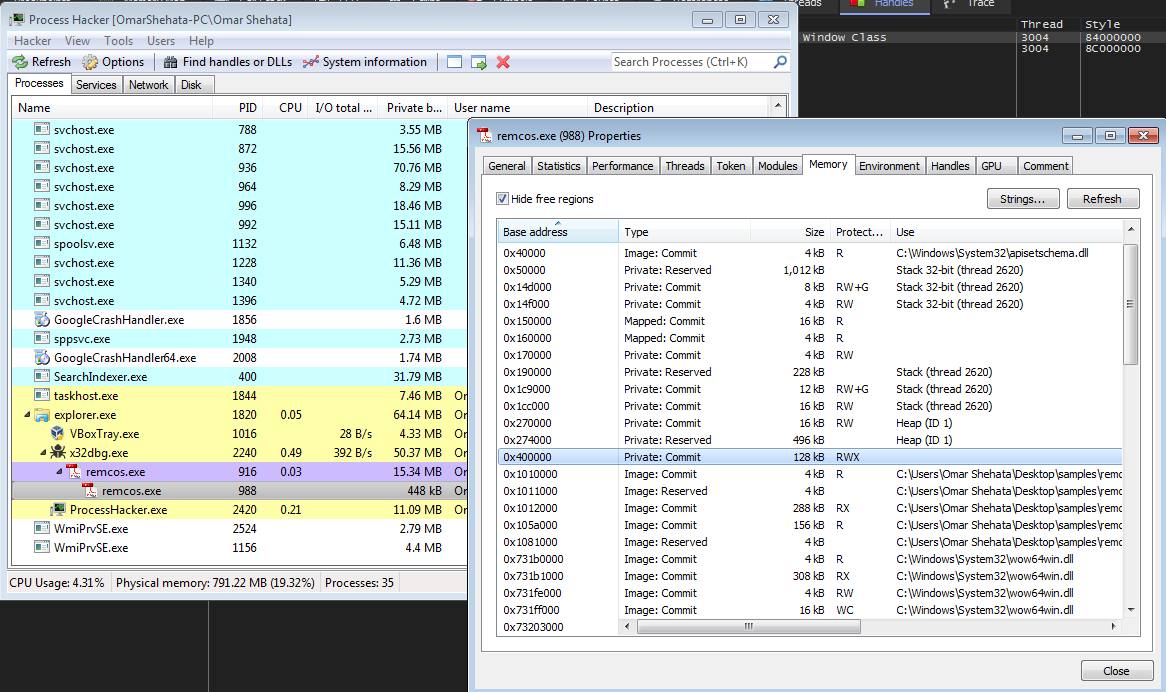
you may see that the PID of the process is different from the previous images, that’s because at this point I accidentally restarted the VM ;)
we are almost done, we just need to modify some values in the header; the address to the sections and the size difference to all the sections can be valid. (make the address of raw = address of virtual and make the size difference between sections right).
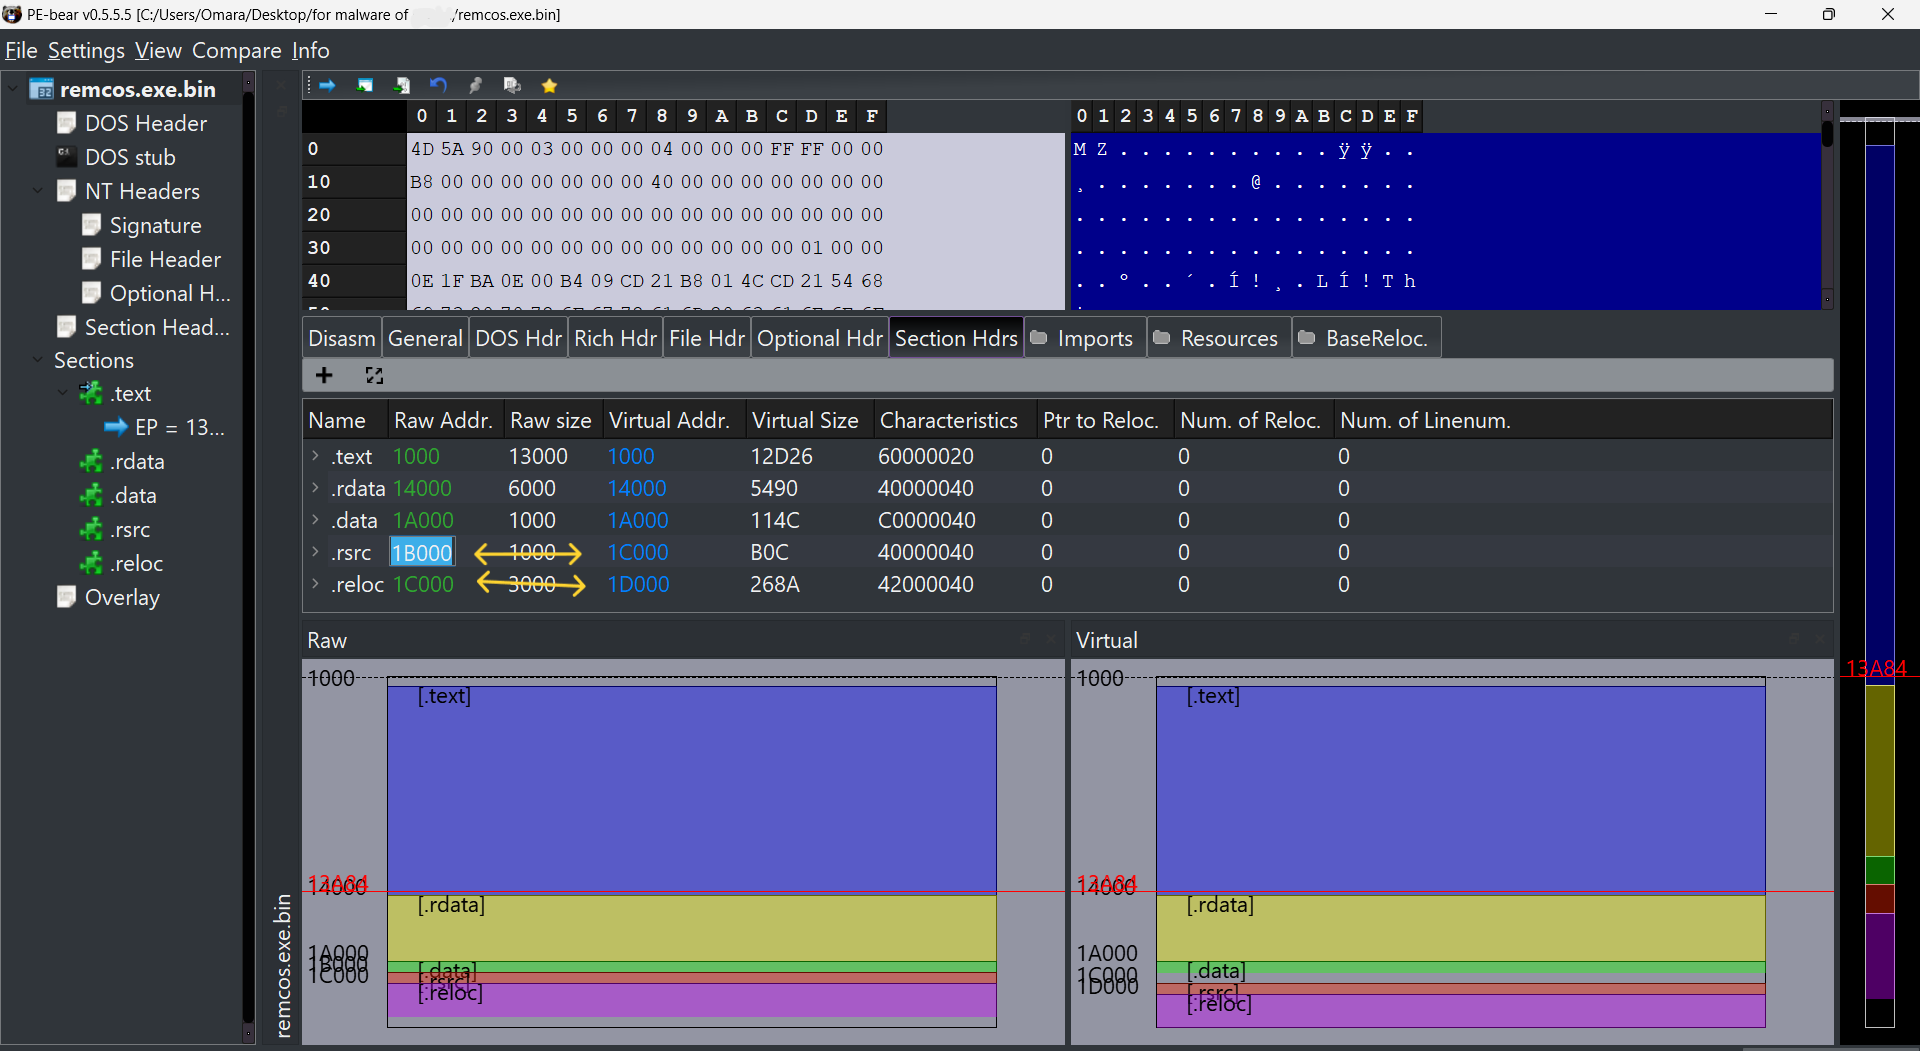
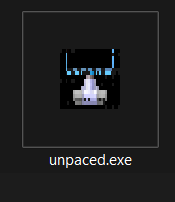
then now safe that and dump. and surprisly ! we got a good binary with beautiful icon and low entropy!
in the next article I will continue the analysis of that RAT.
Wait for me baby!!